Hypoxia

Hypoxia means 'low oxygen'. In aquatic and marine systems, low oxygen generally refers to a dissolved oxygen concentration less than 2 to 3 milligrams of oxygen per liter of water (mg/L), but sensitive organisms can be affected at higher thresholds (4.5 mg/L). A complete lack of oxygen is called anoxia. Hypoxic waters generally do not have enough oxygen to support fish and other aquatic animals, and are sometimes called dead zones because the only organisms that can live there are microbes. 

Hypoxia is a mounting problem affecting the world’s coastal waters, with severe consequences for marine life, including death and catastrophic changes. Low oxygen conditions are forecast to increase due to increased nutrient input and global warming. Hypoxia has been shown to trigger mortality events that deplete animals in the ecosystem, resulting in so-called ‘‘dead zones’’ devoid of fisheries resources, such as fish, shrimp, and crabs.

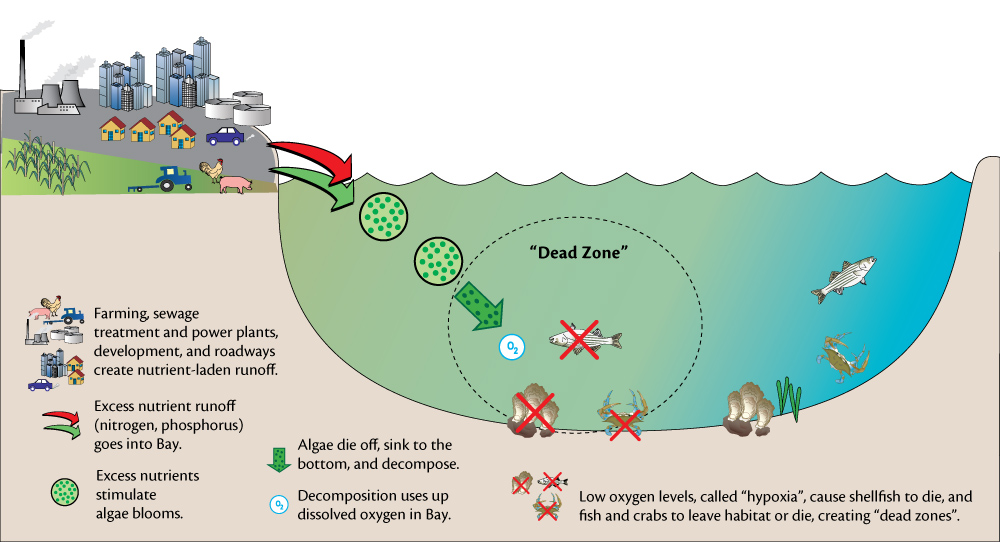
The conceptual diagram illustrates the process that can create low oxygen levels in an estuary. 


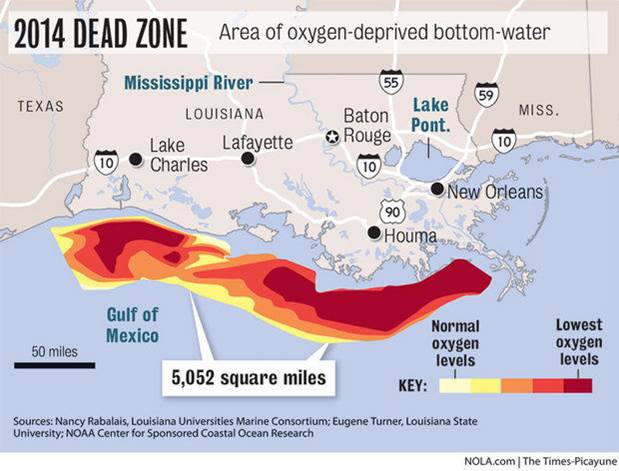
The largest zone of oxygen-depleted coastal waters in the United States is found in the northern Gulf of Mexico on the Louisiana/Texas continental shelf. It is influenced by the freshwater discharge and nutrient load of the Mississippi River system. The mid-summer bottom areal extent of hypoxic waters (≤ 2 mg) in 1985–1992 averaged 8,000 to 9,000 km2 but increased to up to 16,000 to 20,000 km2 in 1993–2000. There is considerable evidence that nutrient-enhanced primary production in the northern Gulf of Mexico is related to the oxygen depletion in the lower water column.


As south Florida has developed, the amount of nutrients coming into the Caloosahatchee River and Estuary has increased. This, in turn, has increased the amount of hypoxic events and decreased biodiversity.

The Fort Myers and Beautiful Island RECON stations have documented significant hypoxic events annually. These events usually occur during the beginning of wet season when water column stratification (due to moderate freshwater flows) and benthic (lowest level of a body of water) oxygen uptake are both increasing.

Created with Highstock 6.0.4DISSOLVED OXYGENHypoxia 2009 - Fort Myers Dissolved OxygenFort Myers - dissolved oxy…Fort Myers - dissolved oxygen7. Jun8. Jun9. Jun10. Jun11. Jun12. Jun13. Jun14. Jun15. Jun16. Jun17. Jun18. Jun19. Jun20. Jun21. Jun22. Jun23. Jun0 mg/l2 mg/l4 mg/l6 mg/l8 mg/l

 The Fort Myers RECON site consistently experienced hypoxic conditions (DO levels below 3 mg/l, red line on graph) during a two week period in June 2009. 

Created with Highstock 6.0.4oxygenSALINITYHypoxia 2009 - Salinity vs. Dissolved OxygenFort Myers - salinity11.522.533.544.555.566.57102.557.512.5

The dissolved oxygen at the Fort Myers RECON in June 2009 was negatively correlated with salinity, thus indicating a positive correlation between salinity and hypoxia . This pattern suggests that hypoxic conditions are present in the lower part of the water column, associated with higher density water. At flood tides, the denser, saltier gulf water acts like a wedge and sinks below the less dense freshwater lens. This wedge migrates daily with the tides. 


The wedge is located in different areas of the river throughout the year. During the wet season it is located closer the mouth depending on flow from small freshwater tributaries and from the rest of the watershed through the Franklin Dam structure, while in the dry season it is less pronounced as the river is more a mixed estuary with increased vertical salinity gradients. During the hypoxic event in June 2009, the wedge was located close enough to the Fort Myers RECON sensor to be detected. Since the RECON sensor is at a fixed distance from the bottom, it was sampling the fresher river water in the surface layer when the tide was low, and saltier water in the lower layer when the wedge moved forward and thickened. Hypoxic conditions were detected regularly, for over two weeks, whenever the saltier layer of the water column extended up to the RECON sensor depth during high tides.


One of the unique features of RECON is that the data is available in near real-time, allowing us to
 observe the hypoxic conditions as they happen, as opposed to after the fact when using more traditional sensors. Because we were aware of the hypoxia, we were then able to conduct additional sampling to determine the extent of the hypoxic zone. On the 12 June 2009, we conducted discrete sampling using a handheld dissolved oxygen sensor. Starting from the downstream edge of the hypoxic zone, the zone extended at least 12.5 km upstream where DO levels were lowest (0.17 mg/l). 


The map shows the dissolved oxygen concentrations in the lower layer of the water column near the bottom in the Caloosahatchee River on June 12, 2009. Contours were extrapolated from 12 sampling sites. Note that the hypoxic layer included depths below 1.5 m, so hypoxia would not usually extend up to the shoreline. 

Created with Highstock 6.0.4DISSOLVED OXYGENHypoxia 2013 - Fort Myers and Beautiful Island Dissolved OxygenFort Myers - dissolved oxy…Fort Myers - dissolved oxygenBeautiful Island - dissolve…Beautiful Island - dissolved oxygen24. Jun1. Jul8. Jul15. Jul22. Jul29. Jul5. Aug12. Aug19. Aug26. Aug2. Sep9. Sep16. Sep23. Sep30. Sep7. Oct14. Oct21. Oct0 mg/l2 mg/l4 mg/l6 mg/l8 mg/l

The red line on this graph shows the 3 mg/l level. Values below this line indicate hypoxic water. 


During the summer and early fall of 2013, another hypoxia event occurred in the river. This event was more pronounced further upstream than the 2009 event; however the Beautiful Island RECON site was not established until late 2012 so we had limited data from this area in 2009.   


Discrete sampling was conducted over a two day period in July 2013.  The data from these samples were interpolated to produce this map. The hypoxic water tended to be concentrated on the southeast side of the river, which is where the main channel and greatest flows are located. The shallower, northwest side of the river tended to have higher oxygen concentrations, most likely from atmospheric interaction. 

Created with Highstock 6.0.4DISSOLVED OXYGENHypoxia 2016 - Fort Myers and Beautiful Island Dissolved OxygenFort Myers - dissolved oxy…Fort Myers - dissolved oxygenBeautiful Island - dissolve…Beautiful Island - dissolved oxygen16. May23. May30. May6. Jun13. Jun20. Jun27. Jun4. Jul11. Jul18. Jul0 mg/l2.5 mg/l5 mg/l7.5 mg/l10 mg/l
Created with Highstock 6.0.4DISSOLVED OXYGENFort Myers and Beautiful Island - Current Dissolved OxygenBeautiful Island - dissolve…Beautiful Island - dissolved oxygen23. Dec24. Dec25. Dec26. Dec27. Dec28. Dec29. Dec30. Dec31. Dec1. Jan2. Jan3. Jan4. Jan5. Jan6. Jan5.5 mg/l6 mg/l6.5 mg/l7 mg/l7.5 mg/l

Image Gallery