What's New
Weather Stations Update
Originally deployed in 2012, thanks to funding from the West Coast Inland Navigation District (WCIND) through a grant from Lee County, the RECON weather stations became the first weather stations in this area located directly over the water. Designed to give researchers and boaters near real-time information on the current over water weather conditions, they quickly became the go to weather source for the local boating community. ...
Read moreThe River, Estuary and Coastal Observing Network (RECON) is a network of water quality sensors deployed throughout the Caloosahatchee river and estuary to provide real-time, water quality data to scientists, policy makers, and the general public.
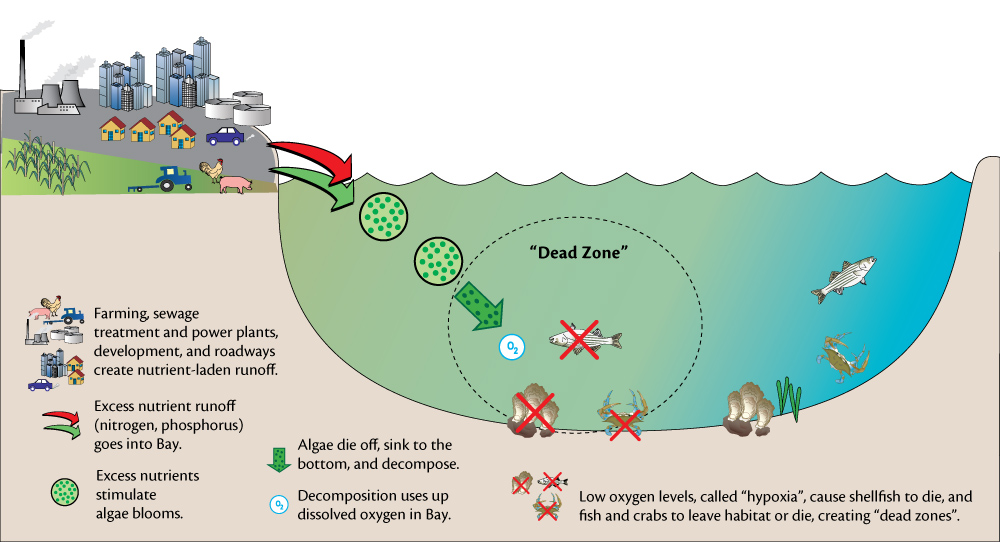
The extensive watersheds of the Caloosahatchee (1,400 square miles) and Lake Okeechobee (4,400 square miles) each contribute water that flows into the Caloosahatchee estuary and the Gulf of Mexico. Water quality is affected by both Lake Okeechobee discharges and runoff from the Caloosahatchee watershed. Over time, these watersheds have changed from low-nutrient loading marshes and wetlands to high loading urban and agricultural land uses. Nutrients increase turbidity and decrease concentrations of dissolved oxygen (DO). In addition, excess nutrients fuel nuisance algal blooms. Losses of low-nutrient adapted communities, such as seagrasses have contributed to changes in fish, crustacean and marine mammal communities.